What the Dongsha dispute, daily military reports, and trade figures reveal about politics and economic exposure.
Analysis prepared 29 October 2026 · News case study 1–16 October 2026 · Latest trade period September 2026
A water-cannon encounter near Dongsha became a diplomatic dispute nearly two weeks later. Meanwhile, Taiwan’s latest trade release showed a record month of goods exports. These developments raise a question that connects politics with economics: how should readers assess maritime risk when commercial activity remains strong? Reuters on the dispute; Reuters on September exports.
The evidence supports a careful distinction between observed activity, economic exposure, and actual disruption. Military reports help describe activity around Taiwan. Trade figures show the scale and distribution of commercial connections. Establishing how a particular incident affects those connections requires an additional step: evidence of changes in shipping, costs, or deliveries.

Start with the date and the location
Taiwan’s Coast Guard said its patrol vessel Yunlin encountered two mainland Chinese fishing vessels near Dongsha on 1 October 2026. In its account, released the next day, the agency said Jin Sha remained after warnings, was sprayed with water, and later lost propulsion. It said it provided assistance and transferred the vessel to a mainland Chinese workboat on 2 October. These details are the Coast Guard’s account of its own operation. Coast Guard release.
At a briefing on 14 October, Taiwan Affairs Office spokesperson Chen Binhua asserted Beijing’s sovereignty claim over Dongsha and criticized Taiwan’s treatment of mainland vessels as dangerous. Reuters also quoted an unnamed Taiwan official who described the operation as proportionate law enforcement. The sources document competing claims about authority and conduct. Official briefing transcript; China News Service; Reuters.
The chronology matters: 1 October was the encounter; 14 October brought a subsequent political response. Dongsha lies in the northern South China Sea, outside the Taiwan Strait itself. It belongs in a discussion of cross-strait relations, with its location made explicit. NASA geographic context.
The available accounts also leave a causal question open. A reported loss of propulsion after water-cannon use does not, by sequence alone, establish what caused the mechanical problem. A stronger reconstruction would require evidence such as technical findings and a fuller record of the encounter.
Read the military figures in their own units
The report issued on 15 October recorded 15 aircraft sorties, 10 naval vessels, and 7 official vessels for the preceding 24-hour window. The 16 October report recorded 8 sorties, 9 naval vessels, and 7 official vessels. Each window ran from 06:00 to 06:00, Taiwan time. These are Taiwan’s reported observations. 15 October report; 16 October report.
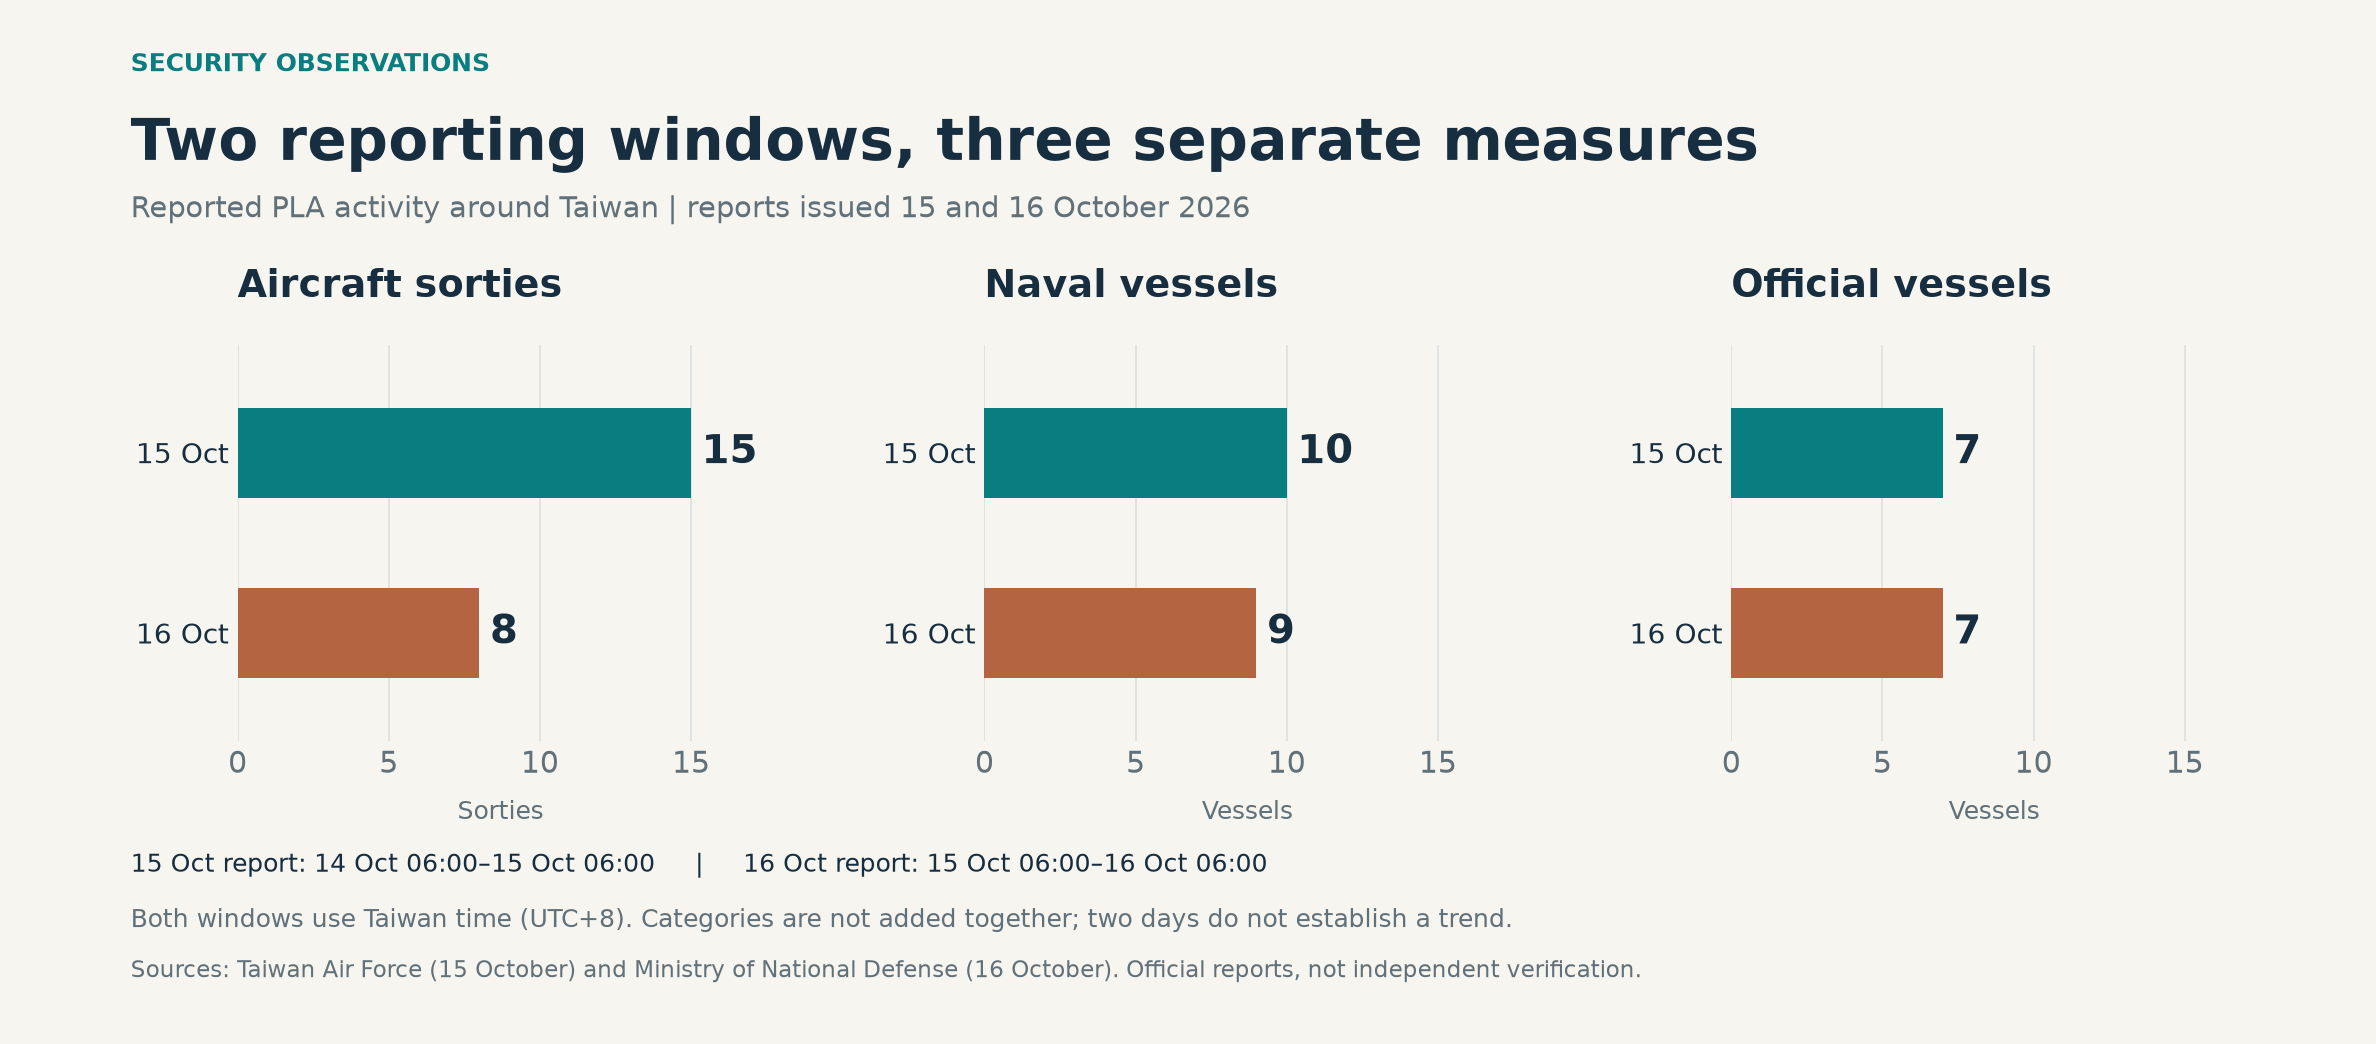
The second report contains fewer sorties and naval vessels, with the official-vessel count unchanged. That answers a limited descriptive question. Two observations cannot establish a sustained trend or quantify the probability of conflict. A sortie is an activity count, so repeated flights by one aircraft need not represent different aircraft. Likewise, crossing the Strait’s median line should not be rewritten as entering territorial airspace.
For a more informative comparison, I would examine a longer series alongside locations, duration, and the character of the operations. A daily total is most useful when it helps identify a change that can then be investigated.
Look at export share and export value together
Economic reporting has a similar measurement problem. Taiwan’s central bank reports that mainland China and Hong Kong received 26.6% of Taiwan’s goods exports in 2025, down from 31.7% in 2024. Yet the value of those exports increased from US$150.589 billion to US$170.477 billion, a rise of 13.2%. The United States’ share rose from 23.4% to 30.9%. Annual Report 2025, page 15.
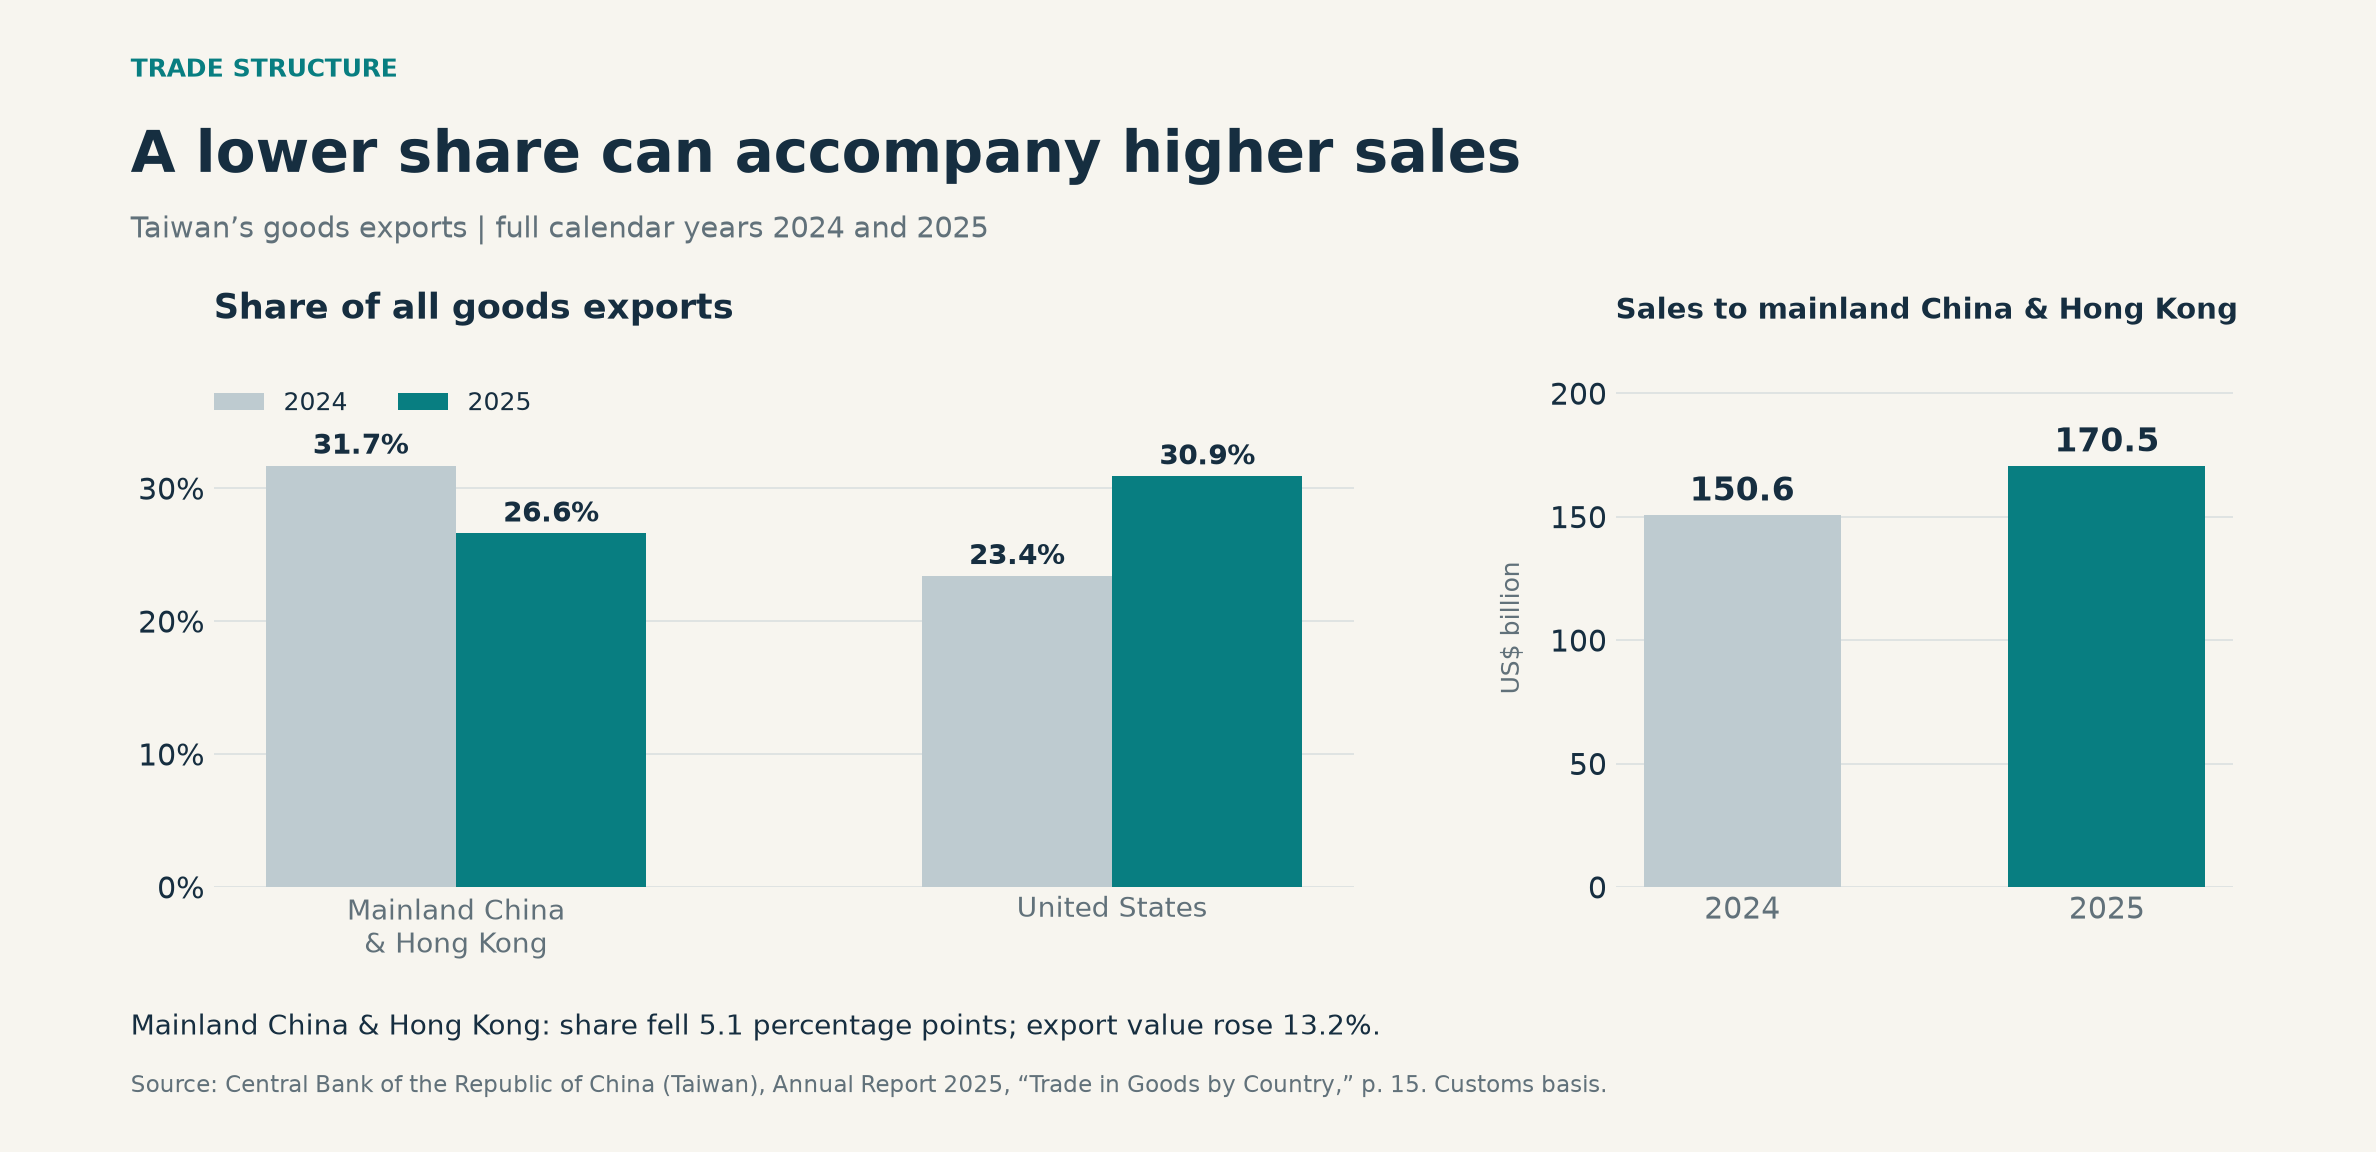
A share measures one destination’s sales relative to total exports. It can fall while the sales themselves increase, when the total grows faster. In this comparison, a smaller share therefore supports a finding of changing market composition; it does not support a claim that trade with mainland China and Hong Kong contracted.
That distinction matters for political analysis. Export diversification can change the distribution of exposure while substantial commercial connections continue. Aggregate figures alone cannot show which firms have become less dependent on a particular customer or how easily they could replace one.
Use the current trade figures with the right timeframe
The Ministry of Finance’s 8 October release put September goods exports at US$87.22 billion, up 60.9% from a year earlier, and imports at US$63.59 billion. For January–September 2026, its table lists the United States, mainland China and Hong Kong, and ASEAN as major export destinations. Official trade release, Tables 1 and 4. Reuters reported strong demand for AI-related chips and technology as a driver of export growth. Reuters economic reporting.
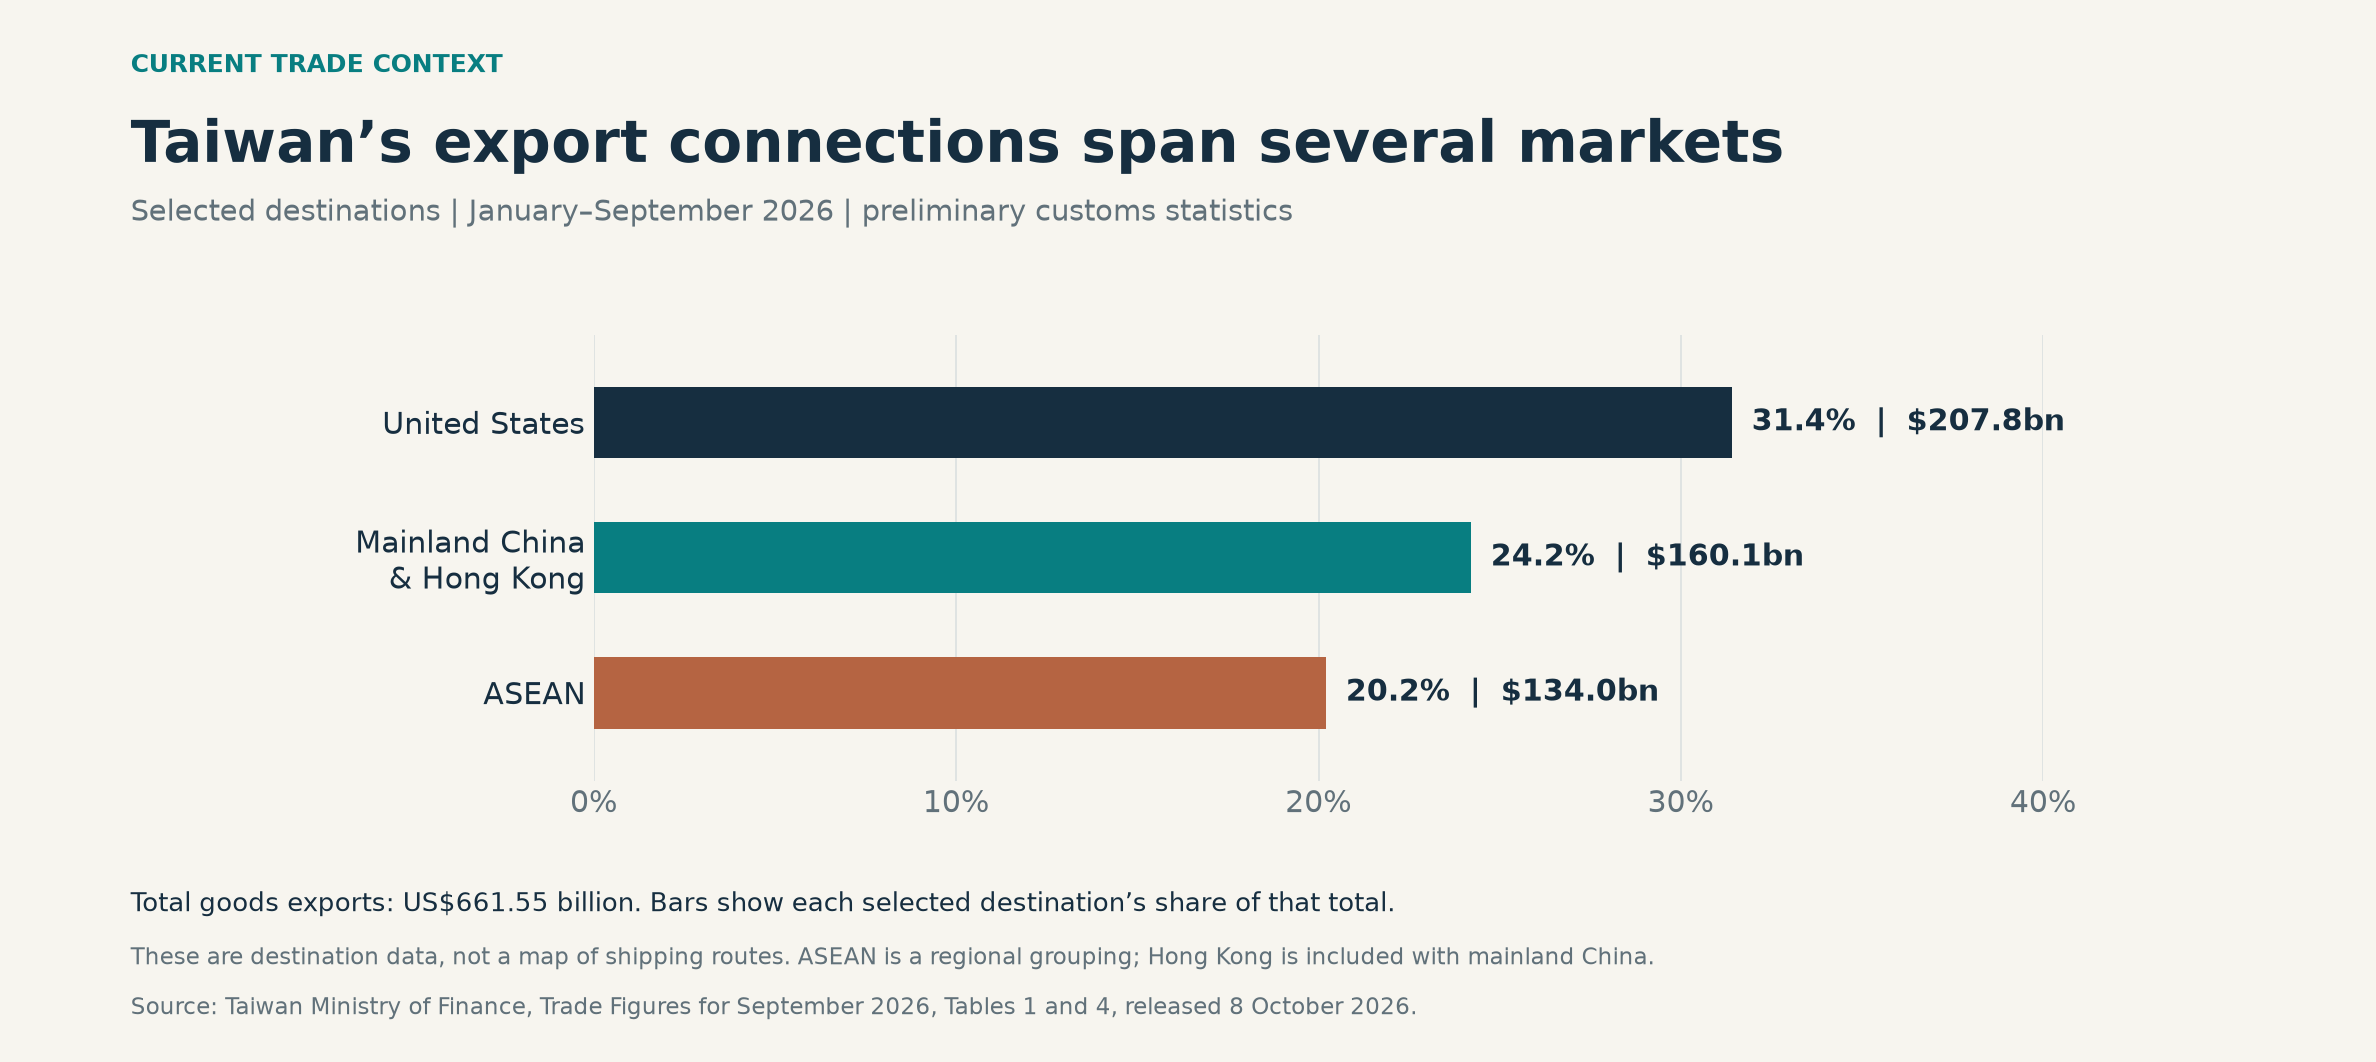
These figures describe commerce before the October encounter. They cannot measure its consequences. The annual comparison in Figure 3 and the nine-month snapshot in Figure 4 also cover different periods; they should not be treated as matching year-on-year observations.
Connect maritime security to economic mechanisms
At a maritime security conference in Taipei on 14 October, participants discussed shipping, energy, supply chains, and economic resilience. CNA reported proposals for stronger maritime awareness and cooperation. The meeting establishes that these vulnerabilities were being discussed; its scenarios do not establish that a blockade or supply interruption had occurred. CNA conference report.
My interpretation is that the most useful economic questions concern how uncertainty could change real decisions. A carrier might alter a route, an insurer might reassess cover, or a manufacturer might increase inventories. Each response would have a different cost, timing, and evidentiary record. These are possible transmission channels, rather than measured consequences of the Dongsha incident.
A follow-up investigation should track:
- Shipping operations: documented changes in port calls, service schedules, or voyage times.
- Transport and insurance costs: dated quotations or published series, with attention to other causes of price changes.
- Deliveries and inventories: company disclosures or commodity-arrival data that reveal an operational effect.
- Business adaptation: identifiable changes in suppliers, customers, or production plans over a consistent period.
Matching these records to the relevant dates would make a causal argument more credible. It would also help distinguish the effects of a maritime incident from demand changes, policy decisions, or unrelated disruptions. The sources examined here support a discussion of exposure and competing official positions. They do not establish an economic loss caused by this encounter.
Why this blog compares sources
This blog considers sources from mainland China, Taiwan, and other countries to explore the relationship between politics and economics and to reduce gaps between Chinese-language and English-language discussions. My interest is in how the same development can generate different accounts, and what careful reading and quantitative comparison can clarify.
For this article, official statements provide records of what authorities reported or claimed; reporting by Reuters and CNA adds context and additional voices. I assess each source by its evidence, transparency, and relevance. Several outlets repeating the same official statement still represent one underlying account. Translations and summaries preserve attribution, and my interpretation is identified separately from reported facts.
Data and image notes
The case study covers events and reporting from 1–16 October 2026 and was prepared on 29 October. The military figures are historical snapshots. Trade amounts are nominal US-dollar customs values for goods, rather than services or shipping volumes. The annual figures follow the central bank’s published table; the 2026 figures follow the preliminary October release. Charts 2–4 are original visualizations of those data. The tables below provide the underlying chart values. Source links identify the relevant official releases. NASA supplied the historical photograph, which is used for geographic context with attribution.
Underlying chart values
| Report date | Aircraft sorties | Naval vessels | Official vessels |
|---|---|---|---|
| 15 October 2026 | 15 | 10 | 7 |
| 16 October 2026 | 8 | 9 | 7 |
| Destination | Year | US$ million | Share of all exports |
|---|---|---|---|
| Mainland China and Hong Kong | 2024 | 150,589 | 31.7% |
| Mainland China and Hong Kong | 2025 | 170,477 | 26.6% |
| United States | 2024 | 111,362 | 23.4% |
| United States | 2025 | 198,274 | 30.9% |
| Destination | US$ million | Share of all exports |
|---|---|---|
| United States | 207,777 | 31.4% |
| Mainland China and Hong Kong | 160,086 | 24.2% |
| ASEAN | 133,959 | 20.2% |
Sources
- Taiwan Coast Guard release, 2 October 2026
- Taiwan Affairs Office briefing transcript, 14 October 2026, hosted by Beijing Taiwan Affairs Office
- China News Service report on the briefing, 14 October 2026
- Reuters on the Dongsha dispute, 14 October 2026, republished by MarketScreener
- Taiwan Air Force activity report, 15 October 2026
- Taiwan Ministry of National Defense activity report, 16 October 2026
- Taiwan central bank Annual Report 2025, Trade in Goods by Country, printed page 15
- Taiwan Ministry of Finance Trade Figures for September 2026, released 8 October 2026, Tables 1 and 4
- Reuters on September exports and technology demand, 8 October 2026, republished by MarketScreener
- CNA on the maritime security conference, 14 October 2026
- NASA Dongsha Atoll photograph, taken 26 January 2021 and published 9 February 2021


Leave a Reply